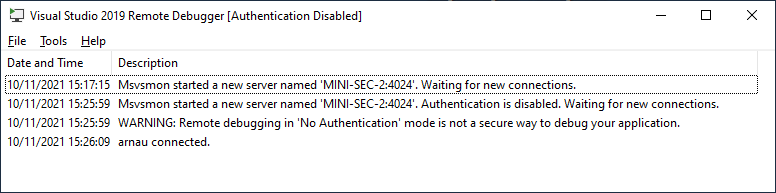
I had an issue in production on some C# application, which required me to use the Visual Studio Remote Debugging Tools, which include the handy Visual Studio 2019 Remote Debugger.
When the remote debugger starts, it tells us on which address it is waiting for connections. In my case, it was on port 4024 of the machine where I was running into trouble.
Since the PC was sitting behind a NAT and a firewall, I could not reach it from home without setting up a VPN. I wondered how I could access the running msvsmon.exe without having to go through the deployment of a VPN or an SSH tunnel.
Create a TCP tunnel with ngrok
I had been using ngrok to make some HTTP service sitting behind a NAT available from the outside world, but I did not realize that this nifty tool can also be used to make any TCP port visible publicly.
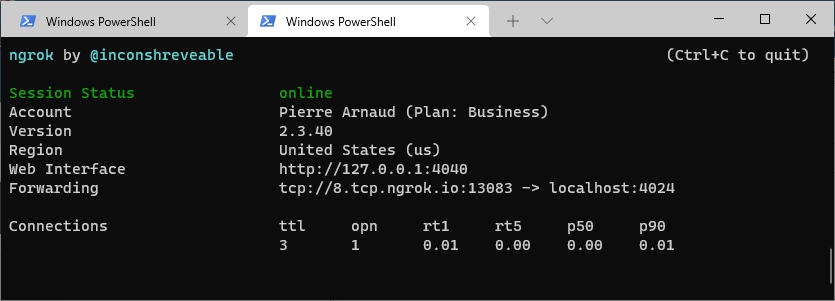
Just install ngrok for Windows on the machine where msvsmon.exe is running. Then open a command prompt and make the TCP port visible from outside:
1./ngrok tcp 4024
The tool displays the forwaring address (for instance 8.tcp.ngrok.io:13083) mapped to the TCP port 4024.
It looks like this:
Connect Visual Studio to msvsmon over ngrok
Connecting Visual Studio to the remote debugger can the be done as usual, by using the forwarding address provided by ngrok.
Use command Debug > Attach to Process then select the Remote (no authentication) connection type and enter the forwarding address into the Connection target:
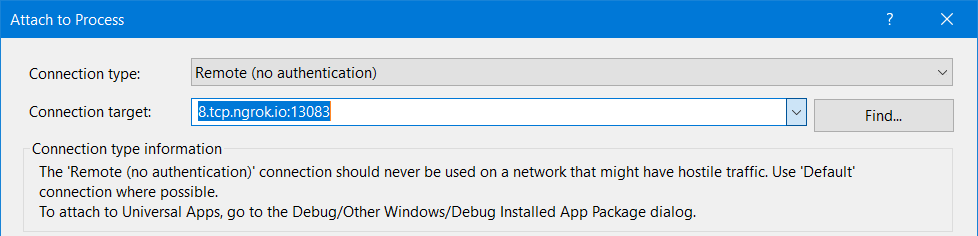
After a few seconds, the available processes should show up and you can attach to the culprit and debug it.